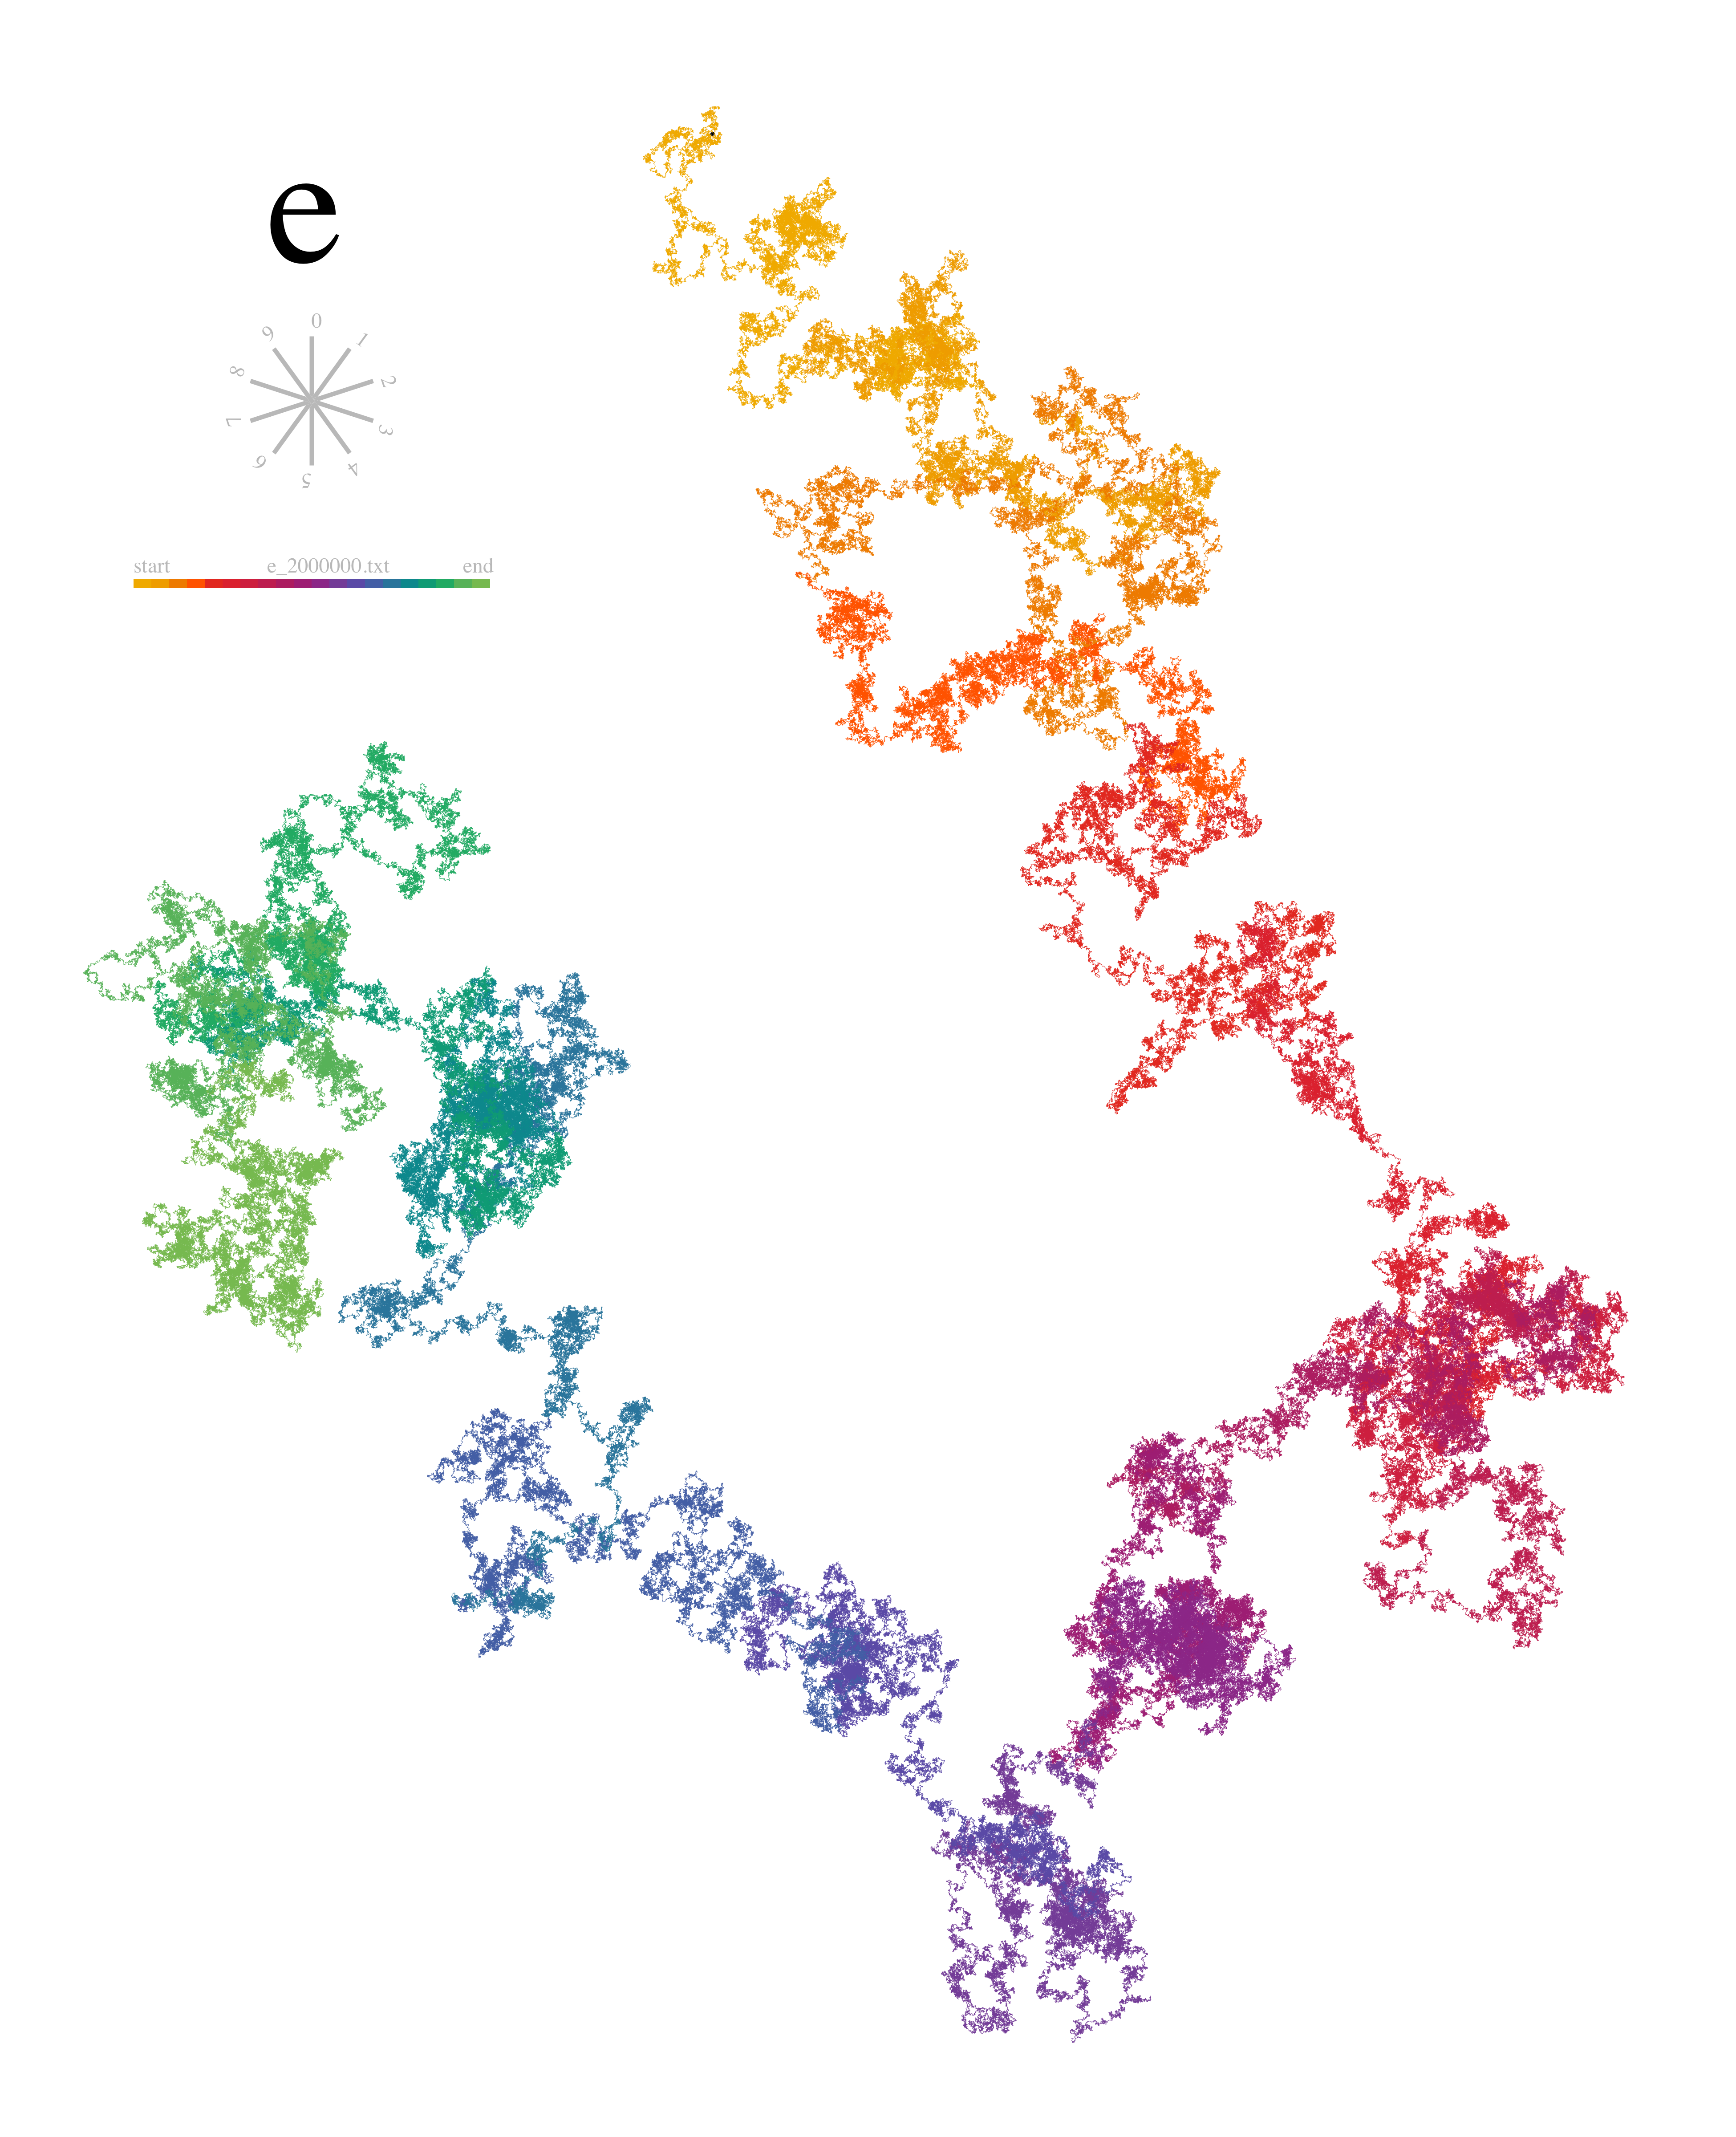
Drawing the n million digits of π and e, along with Swift source code. Inspired by http://www.visualcinnamon.com/2015/01/exploring-art-hidden-in-pi.html [OC]
![Drawing the n million digits of π and e, along with Swift source code. Inspired by http://www.visualcinnamon.com/2015/01/exploring-art-hidden-in-pi.html [OC]](https://raw.githubusercontent.com/nst/BitmapCanvas/master/img/e_walk.png)
🎙️ nst021 · 226 points · Posted at 09:27:08 on June 12, 2016 · (Permalink)
🎙️ nst021 · 226 points · Posted at 09:27:08 on June 12, 2016 · (Permalink)
MesePudenda · 14 points · Posted at 14:31:06 on June 12, 2016 · (Permalink)
Title mentions the pi walk, but I don't see the link. It's a little less square
[deleted] · 3 points · Posted at 17:39:37 on June 12, 2016 · (Permalink)
4, 8, 1, 4
Shloosh · 11 points · Posted at 15:55:43 on June 12, 2016 · (Permalink)
This is a base-10 visualization. I wonder what base-2 or other bases would look like. Probably equally as chaotic, but would still be interesting.
jwfreund · 5 points · Posted at 16:43:47 on June 12, 2016 · (Permalink)
You beat me by 2 minutes! I'm wondering the same, and I'm recreating this in Rhino + Grasshopper and seeing if there is a most interesting base.
Ohsochefly · 3 points · Posted at 14:46:49 on June 15, 2016 · (Permalink)*
Here is some quick code I threw together to look at just that! It doesn't generate pi, and it doesn't look all snazzy and colored, but it show geometrically how different bases affect the outcome.
edit: sample comparison output http://imgur.com/DO0K3DI
aeromathematics · 1 points · Posted at 23:11:45 on June 12, 2016 · (Permalink)*
This comment has been overwritten by an open source script to protect this user's privacy. It was created to help protect users from doxing, stalking, harassment, and profiling for the purposes of censorship.
If you would also like to protect yourself, add the Chrome extension TamperMonkey, or the Firefox extension GreaseMonkey and add this open source script.
Then simply click on your username on Reddit, go to the comments tab, scroll down as far as possible (hint:use RES), and hit the new OVERWRITE button at the top.
joysofpi · 1 points · Posted at 02:41:27 on June 13, 2016 · (Permalink)
quick! someone do a 3d visualization using base 6. or slices of a 4d representation in base 8?
xXTurdleXx · 9 points · Posted at 12:55:20 on June 12, 2016 · (Permalink)
How does this map work?
hiplobonoxa · 12 points · Posted at 14:30:57 on June 12, 2016 · (Permalink)
the point walks depending on the digit. for example, if the next digit is 0, the point moves up and if the next digit is five the point moves down. the idea being that the digits of pi, if random, would produce a random walk, since every number would have an equal probability of appearing next. in that case, the point would just wobble around a central location. it seems, based on this, that 2-6 are more likely to appear for the first part, then 5-8, and finally 7-1. interesting. and nice color choice!
can you do this for other important numbers? the gravitational constant? the gas constant? e? a random number?
Hax0r778 · 8 points · Posted at 18:43:57 on June 12, 2016 · (Permalink)
Actually with Brownian motion the point wouldn't wobble around the center. It would leave the center at an average speed of sqrt(2). See source
[deleted] · 6 points · Posted at 16:07:32 on June 12, 2016 · (Permalink)
I agree with your explanation of how the graph is constructed, but the Pi chart looks awfully like a random walk to me.
Azzaman · 3 points · Posted at 23:06:29 on June 12, 2016 · (Permalink)
Isn't that what the original post was?
SmashBusters · 2 points · Posted at 21:05:27 on June 12, 2016 · (Permalink)
These are measured values so it won't be very interesting.
sun_worth · 6 points · Posted at 22:16:03 on June 12, 2016 · (Permalink)
The gravitational constant is only known to 4 or 5 digits, and the gas constant is known to 5 or 6 digits. It would be a very short walk.
woofwoofwoof · 2 points · Posted at 04:27:52 on June 13, 2016 · (Permalink)
Actually, true random numbers have clusters of similarity and clusters of non-similarity.
If a random number wobbled around a central point, then it wouldn't be random.
stats_commenter · 1 points · Posted at 02:12:22 on June 14, 2016 · (Permalink)
One of the first facts about a random walk is that it moves away from its starting point.
Ydu_alvalo · 5 points · Posted at 12:59:16 on June 12, 2016 · (Permalink)
Very cool!! Can you also post n million digits of a random generated number? I would be interesting to see if there are apparent differences.
retothej · 4 points · Posted at 19:31:54 on June 12, 2016 · (Permalink)
I quickly made a crude black-and-white version of 10000000 randomly generated numbers between 0 and 360 (degrees) which are then mapped to x-y space. Conceptually, there should not be a difference right? Except for rounding of angle, basically! http://imgur.com/1XoqILW
Ydu_alvalo · 1 points · Posted at 04:30:38 on June 13, 2016 · (Permalink)
Very cool. I don't fully oversee what you have done, but say you randomly generate a sequence of numbers 0-9 from a uniform distribution and plot them in exactly the same way as pi, you would wonder if you could visually see differences in the images. Btw, (apart from pi), I've also done this with gene sequences and pieces of music (Bach and Mozart). They all get super awesome pictures.
[deleted] · 5 points · Posted at 10:51:35 on June 12, 2016 · (Permalink)
4, 6, 9
Tomus · 2 points · Posted at 16:25:51 on June 12, 2016 · (Permalink)
Damn you're fine...
[deleted] · 1 points · Posted at 21:34:06 on June 12, 2016 · (Permalink)
Thanks.
I thought it was clear, wasn't it ?
Fingebimus · 3 points · Posted at 11:13:25 on June 12, 2016 · (Permalink)
This looks great!
rhiever · 1 points · Posted at 13:11:48 on June 12, 2016 · (Permalink)*
Please add the data source and tool(s) used as a comment on this thread or---per the subreddit rules---we will have to remove your post.
🎙️ nst021 · 10 points · Posted at 13:29:23 on June 12, 2016 · (Permalink)
code and tools: https://github.com/nst/BitmapCanvas/
data source for pi digits: https://www.angio.net/pi/digits.html
data source for e digits: http://apod.nasa.gov/htmltest/gifcity/e.2mil
rhiever · 2 points · Posted at 13:33:11 on June 12, 2016 · (Permalink)
Thanks! Your post is approved.
chodeface · 1 points · Posted at 12:31:26 on June 12, 2016 · (Permalink)
Reminds me a little bit of a map of Earth. Our own little slice of the pi.
fb39ca4 · 1 points · Posted at 21:02:08 on June 12, 2016 · (Permalink)
What is the scale of the image? How many steps across?
QuantumPuma · 1 points · Posted at 21:24:50 on June 12, 2016 · (Permalink)
I did something like this once. It looked like a cat.
LamTCD · 1 points · Posted at 00:11:02 on June 13, 2016 · (Permalink)
Looks like an altered Great Britian. Pretty fascinating.
munky86 · 1 points · Posted at 19:50:05 on June 13, 2016 · (Permalink)
Did this once too for pi day in base 4 Link